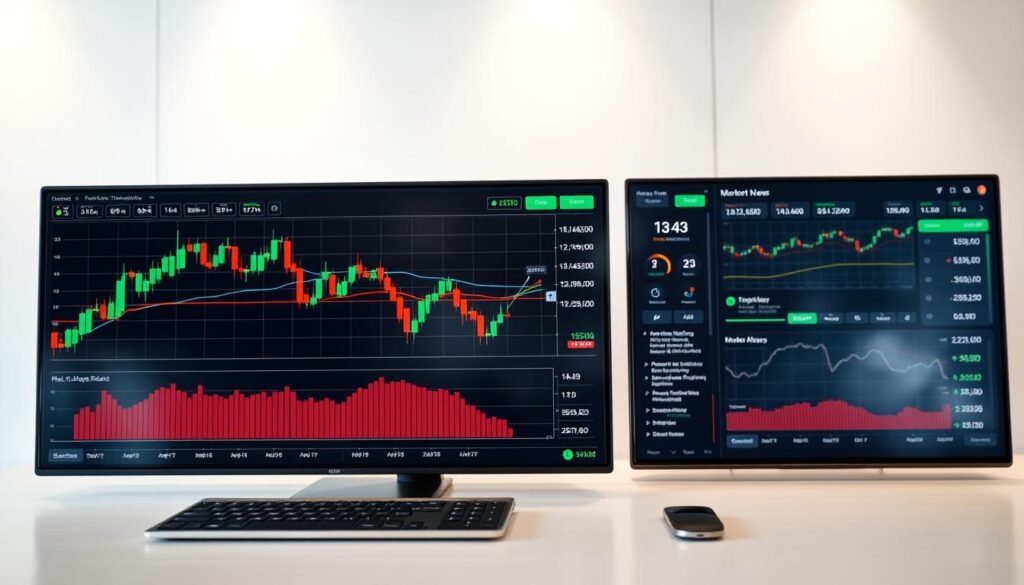
Modern traders face rapidly shifting markets across stocks, crypto, and commodities. Powerful analytical tools now provide real-time insights into indices like the S&P 500, Nasdaq 100, and FTSE 100. These resources help identify trends in assets ranging from Apple shares to emerging cryptocurrencies.
Platforms offering live data feeds have transformed how professionals approach decision-making. Real-time tracking of market movers – including Tesla or NVIDIA stock fluctuations – enables swift reactions to volatility. Community-driven trend analysis further enhances this process, combining crowd wisdom with technical indicators.
Sophisticated charting systems cater to all experience levels. New traders gain clarity through intuitive interfaces, while experts use advanced features like earnings calendar integrations. This adaptability makes such tools indispensable for navigating today’s interconnected financial landscape.
From forex pairs to oil price movements, comprehensive coverage ensures no opportunity goes unnoticed. The blend of historical data patterns and live market sentiment creates a robust framework for strategic planning. Whether monitoring Bitcoin’s swings or traditional equity indices, these solutions deliver the precision modern trading demands.
Understanding TradingView Charts and Their Impact on Technical Analysis
Financial markets demand tools that combine precision with adaptability. One standout solution offers traders a dynamic way to analyze price movements across assets like the FTSE 100 or emerging cryptocurrencies. Its cloud-based design ensures seamless transitions between devices while maintaining up-to-the-minute accuracy.
What Sets These Tools Apart
The platform’s partnerships with top financial data providers deliver reliable feeds for UK markets and global exchanges. Users access synchronized layouts, real-time collaboration, and 20+ workspace configurations. Social features let traders exchange ideas with a worldwide network, blending crowd insights with technical indicators.
Advantages for British Market Participants
Local traders benefit from instant access to LSE stocks and international indices through a single interface. Custom alerts notify users about shifts in fast-moving assets like oil or Bitcoin, even during off-hours. Integration with UK brokers streamlines order execution, turning analysis into action without delays.
Flexible watchlists and screening tools adapt to individual strategies, whether tracking blue-chip shares or forex pairs. This combination of depth and simplicity makes the platform essential for navigating today’s interconnected financial landscape.
Key Features and Tools Shaping the Trading Experience

Effective trading platforms empower users through customizable interfaces and precision-driven workflows. These systems bridge the gap between analysis and action, offering tools that adapt to both scalpers and long-term strategists.
Multiple Chart Layouts and Drawing Tools
Traders can configure up to 20+ layout variations, from single-screen setups to multi-panel displays. This flexibility lets users track diverse assets like the FTSE 100 and crypto markets side-by-side. Advanced drawing tools extend beyond basic trendlines, featuring:
- AVWAP indicators for volume-weighted price analysis
- Fibonacci grids for retracement predictions
- Customizable support/resistance zones
Real-Time Data, Order Execution, and Indicator Integration
Instant price updates sync across all layouts, ensuring decisions align with live market movements. The platform’s drag-and-drop order system lets traders adjust positions directly on charts. Key execution features include:
- One-click basket orders for multi-asset strategies
- Visual stop-loss adjustments via chart interactions
- Native integration of technical indicators with order workflows
This seamless blend of data and action removes friction between spotting opportunities and capitalizing on them. Traders maintain full analytical depth while executing orders in under three seconds.
Exploring “tradingview charts” for Enhanced Market Insights
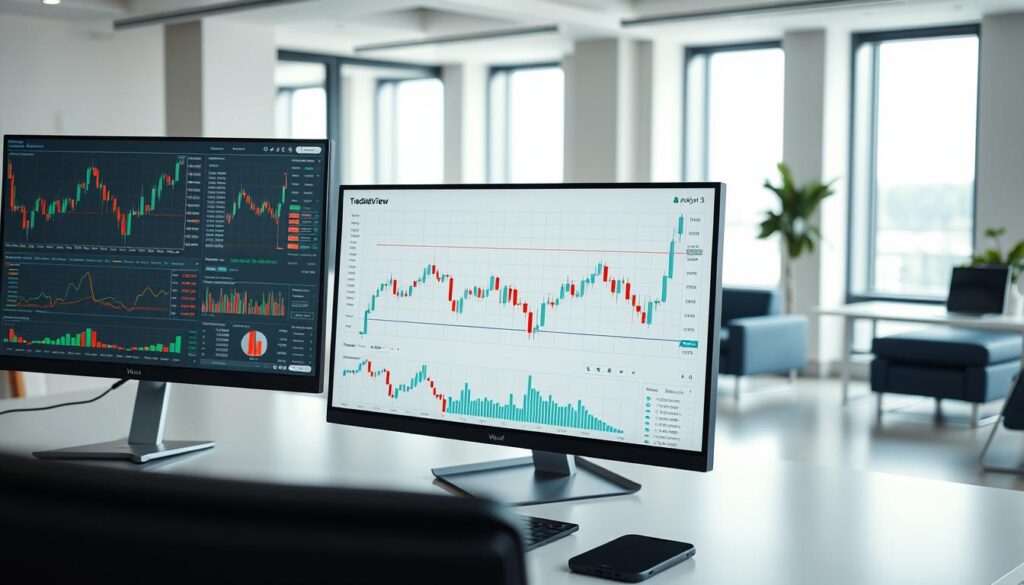
Modern markets thrive on pattern recognition and rapid data interpretation. Advanced analytical tools now decode complex price movements across assets like Bitcoin and Ethereum, transforming raw numbers into actionable signals. This capability proves vital when tracking volatile crypto gainers like Sturdy (+162.58%) or sudden drops in assets like Measurable Data Token.
Spotting Opportunities Through Pattern Recognition
Automated detection systems identify classic formations such as head-and-shoulders or double tops across timeframes. These algorithms scan thousands of instruments, from traditional stocks to altcoins, alerting traders to potential breakouts. Three key features enhance this process:
- Multi-asset pattern matching for simultaneous analysis
- Customizable candlestick interpretations
- Volume-based confirmation signals
Price dynamics become clearer through layered technical indicators. Traders combine moving averages with community-developed tools to assess market sentiment. Real-time scanning filters opportunities using criteria like volatility thresholds or sudden volume spikes.
Synchronized layouts enable multi-timeframe analysis without switching screens. Users examine long-term trends while monitoring entry points on shorter intervals. Historical backtesting further refines strategies by testing theories against years of market data.
Community insights add depth to technical analysis. Shared trading ideas and live discussions help validate personal observations, creating a collaborative environment for decision-making. This fusion of technology and collective wisdom elevates market interpretation beyond basic chart reading.
Seamless Platform Integration for a Unified Trading Experience
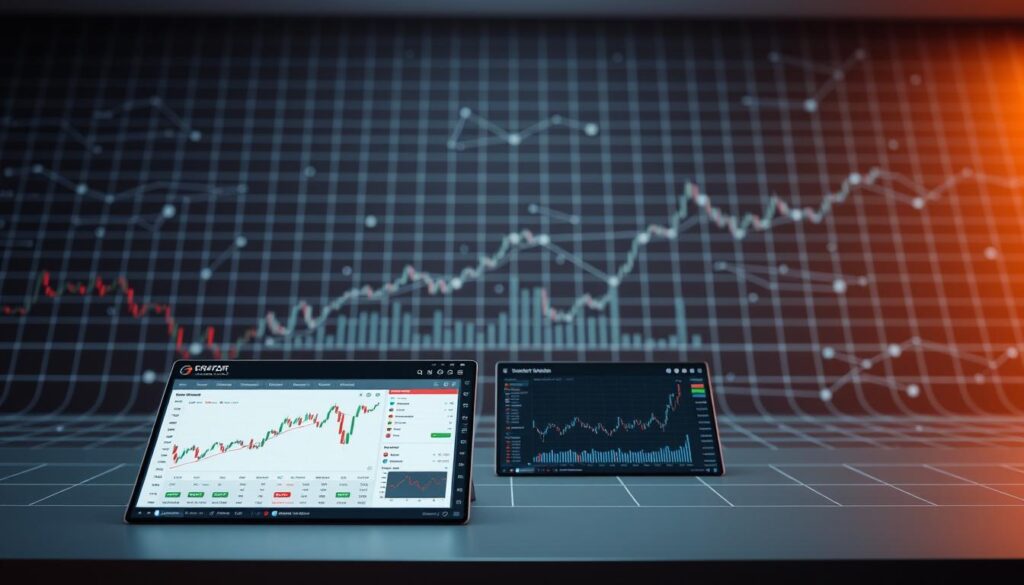
Successful trading demands tools that work together effortlessly. A unified platform bridges analysis and execution, letting traders focus on strategy rather than technical hurdles. This integration becomes crucial when managing multiple assets across global markets.
Desktop and Mobile Accessibility
The desktop mobile experience maintains full functionality across devices. Watchlists sync instantly between smartphones and computers, ensuring traders never miss critical movements in assets like the FTSE 100 or Bitcoin. Touch-optimized chart tools on mobile apps mirror desktop capabilities, from drawing trendlines to setting price alerts.
Real-time access to positions allows quick adjustments during market swings. Users review portfolio performance during commutes or meetings without compromising analytical depth. Feature parity across devices means stop-loss orders and technical indicators behave identically, regardless of screen size.
Linking Brokerage Accounts and Trading Platforms
Connecting broker accounts transforms analysis into action. Supported providers like TradeStation and FOREX.com enable direct order execution from charts. Secure API links ensure real-time balance updates and position tracking without exposing login credentials.
Multi-account management simplifies handling diverse assets. A single dashboard might display crypto holdings through OKX alongside traditional equities from another provider. This setup reduces platform-switching fatigue while optimizing trade execution costs.
Advanced traders leverage this integration to test strategies across markets simultaneously. Live margin calculations and profit-loss summaries appear beside price charts, creating a cohesive decision-making environment. The result? A streamlined experience where insights directly fuel outcomes.
Strategies for Advanced Technical Analysis and Trade Execution

Elevating trading strategies requires precision tools and adaptive methods. Seasoned traders combine technical indicators with disciplined risk management to navigate fast-moving markets. This approach turns complex price action into calculated decisions.
Using Custom Indicators and Advanced Drawing Tools
Pine Script enables traders to build indicators matching their unique strategies. These tools analyze everything from entry levels to volatility patterns. Advanced drawing features like Andrews’ Pitchfork and Gann fans identify hidden trends across assets.
Geometric patterns help predict potential breakouts in forex pairs or indices. Traders layer these tools with volume analysis for confirmation. The result? Sharper insights into market timing and position sizing.
Optimizing Stop Loss and Entry Strategies
Dynamic trailing stops adjust automatically to price swings. This protects profits during sudden reversals while letting winning trades develop. Entry strategies use multiple checks – like momentum shifts at key support levels – to reduce false signals.
Risk calculators determine optimal trade sizes based on account size and volatility. Long-term investors backtest strategies against decades of data. Conditional orders execute at precise technical thresholds, turning analysis into action.
Connecting with the Trading Community and Expert Resources
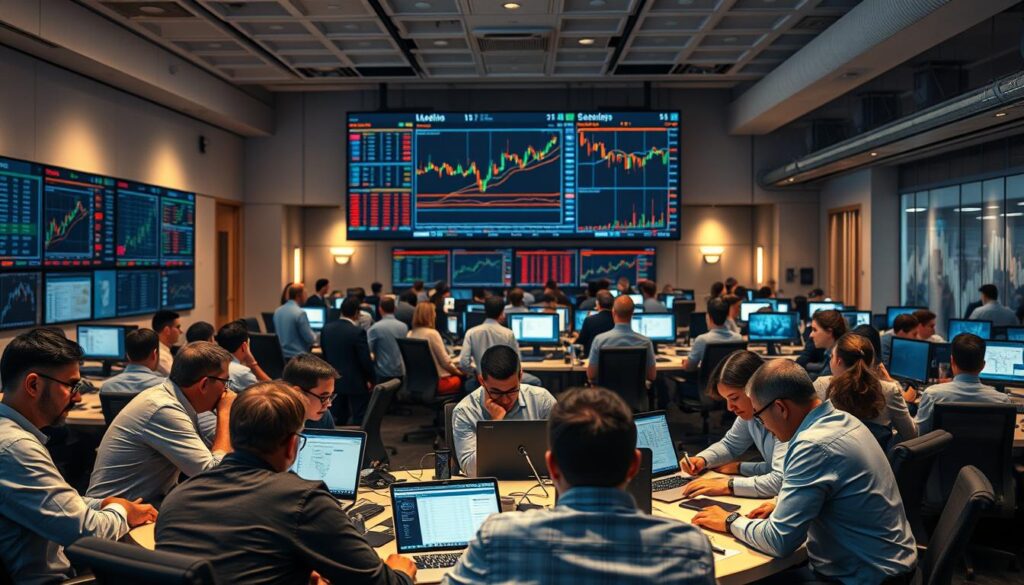
Collaborative knowledge sharing transforms how market participants approach opportunities. Thousands of active traders exchange insights daily across popular instruments like Apple Inc shares and BTCUSD crypto pairs. This collective intelligence helps decode complex movements in assets from tech stocks to altcoins.
Leveraging Community Trends and Data-Driven Insights
Seasoned investors frequently share detailed analyses of stock trading setups and crypto patterns. These posts often include entry points, risk assessments, and profit targets. Many contributors have honed their strategies over years of navigating bull markets and sudden price drops.
Three key benefits emerge from community engagement:
- Real-time sentiment tracking for assets like Amazon.com or DOGEUSD
- Access to professional-grade deep dive tutorials on technical analysis
- Interactive discussions refining long-term investment strategies
New traders gain mentorship opportunities through social features. Users can replicate proven approaches while avoiding common pitfalls. The platform’s data-rich environment combines crowd wisdom with institutional-grade research tools.
Expert webinars dissect emerging trends in indices and cryptocurrencies. These sessions often highlight instruments gaining traction, like Broadcom Inc or ETHUSD. By blending community signals with personal analysis, investors make informed decisions in fast-moving markets.
Bringing It All Together for a Superior Trading Performance
Superior trading performance emerges from combining technical expertise with streamlined workflows. Modern platforms unite real-time analysis and order execution, letting traders act swiftly on opportunities across global markets. Integrated account management tools track positions while maintaining risk parameters, crucial for handling volatile assets.
Mastering price movements becomes achievable through advanced charting features. Traders identify critical support levels and emerging patterns using historical data overlays. The platform adapts to various experience levels, offering simple layouts for newcomers and multi-screen setups for complex strategies.
Long-term success hinges on balancing technical skills with disciplined risk management. The community accelerates learning by sharing proven methods refined over years. Seasoned participants often highlight entry points and exit triggers that align with market shifts.
Full access to trading infrastructure from any device ensures no critical moment slips by. Whether adjusting stop-loss orders or analyzing emerging trends, every tool remains at traders’ fingertips. This holistic approach transforms isolated trades into consistent results.


